the experiment view is your primary interface during training. it shows reward curves, per-component breakdowns, and a rollout deepdive where you can inspect individual completions.
reward curves
the train tab shows four top-level charts that track aggregate training progress over steps.
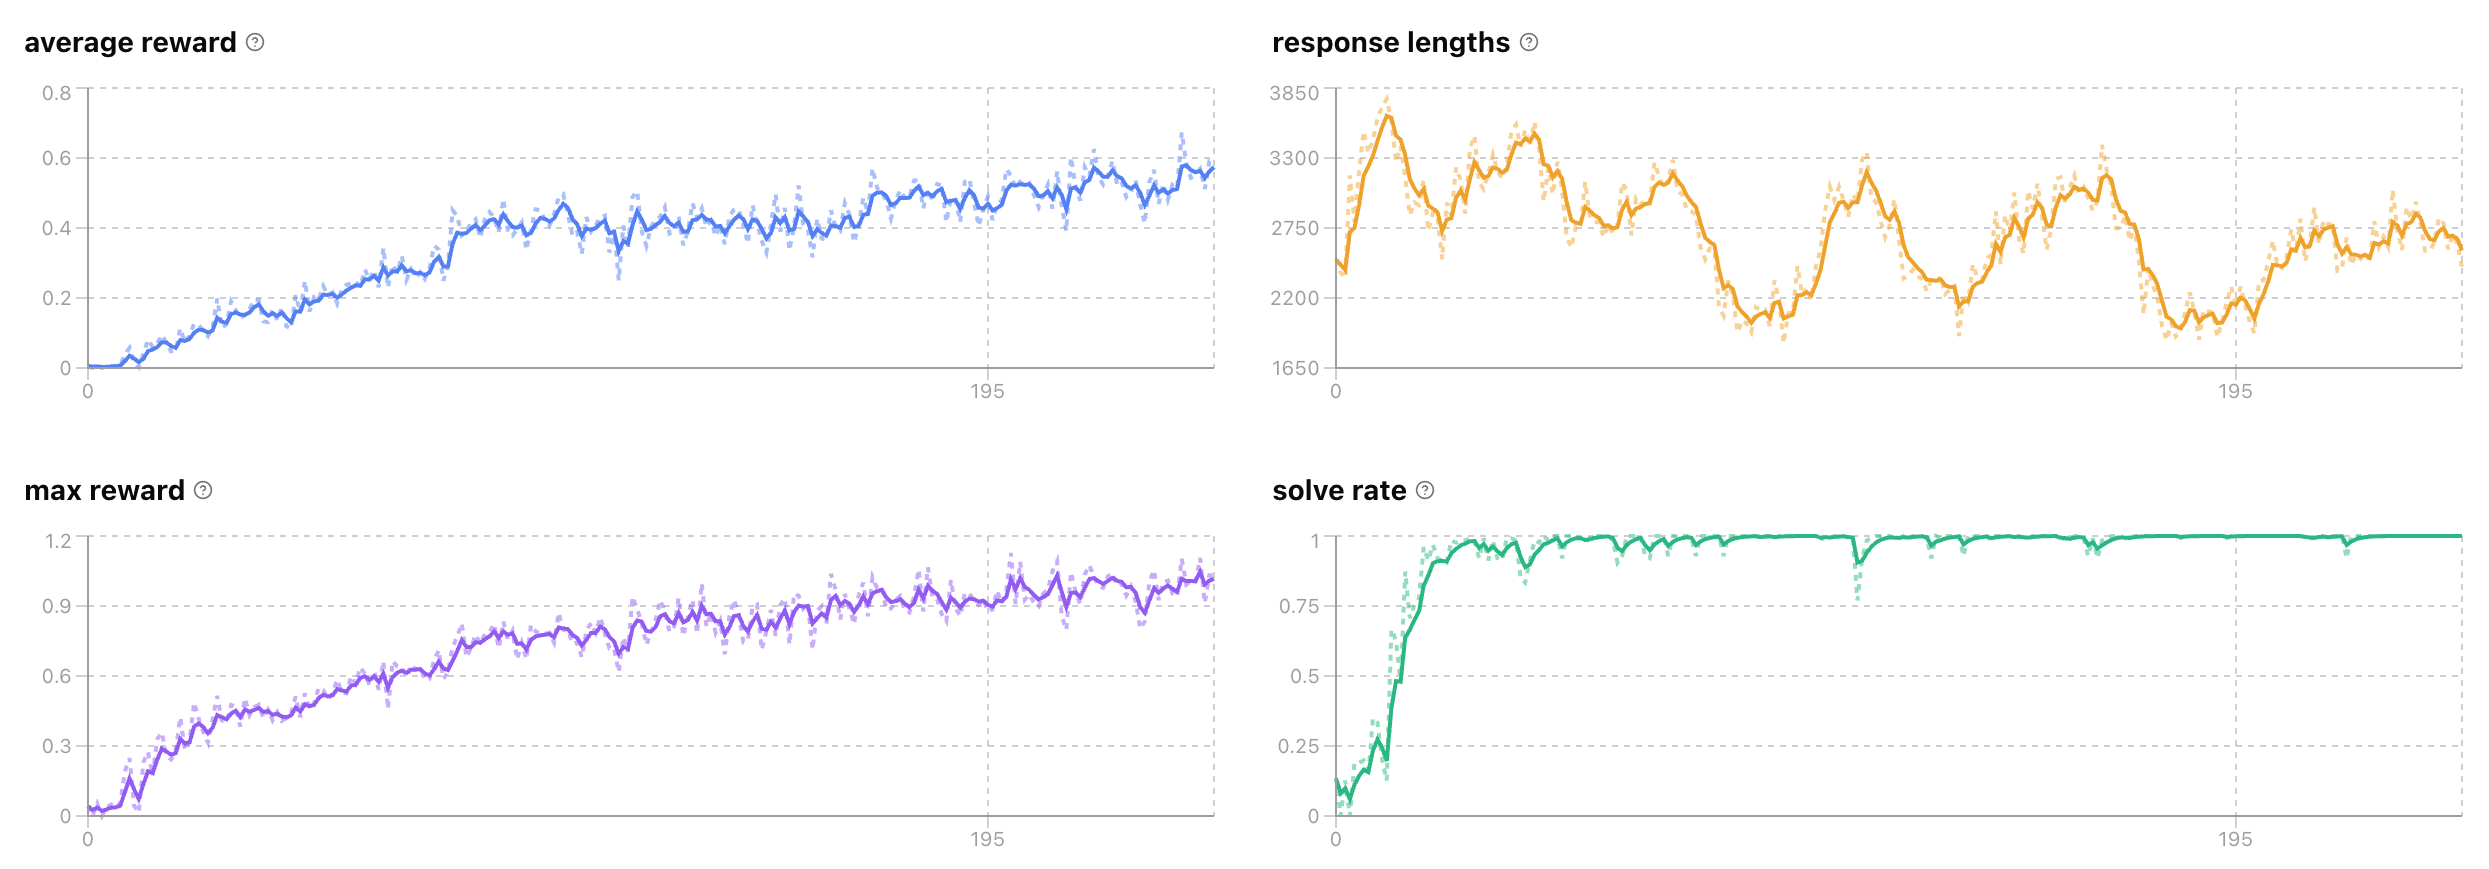
- average reward: the mean reward across all rollouts in a given training step. should continue to improve throughout training. if it plateaus, the model has stopped learning.
- response lengths: the average number of tokens the model uses per answer. should stabilize or decrease. if it rises continuously, consider adding a conciseness subreward.
- max reward: the average of the highest reward across all rollouts for each prompt in a given training step. should continue to improve throughout training. if this decreases, the model may not be generalizing well.
- solve rate: percentage of prompts with a non-zero reward in at least one rollout (also known as pass@k). you want solve rate to climb first (breadth), then average reward follows (depth).
subreward breakdown
if your reward function returns multiple components (see rewards), each component gets its own collapsible section below the top-level charts. expand any component to see its mean, max reward, and solve rate tracked independently.
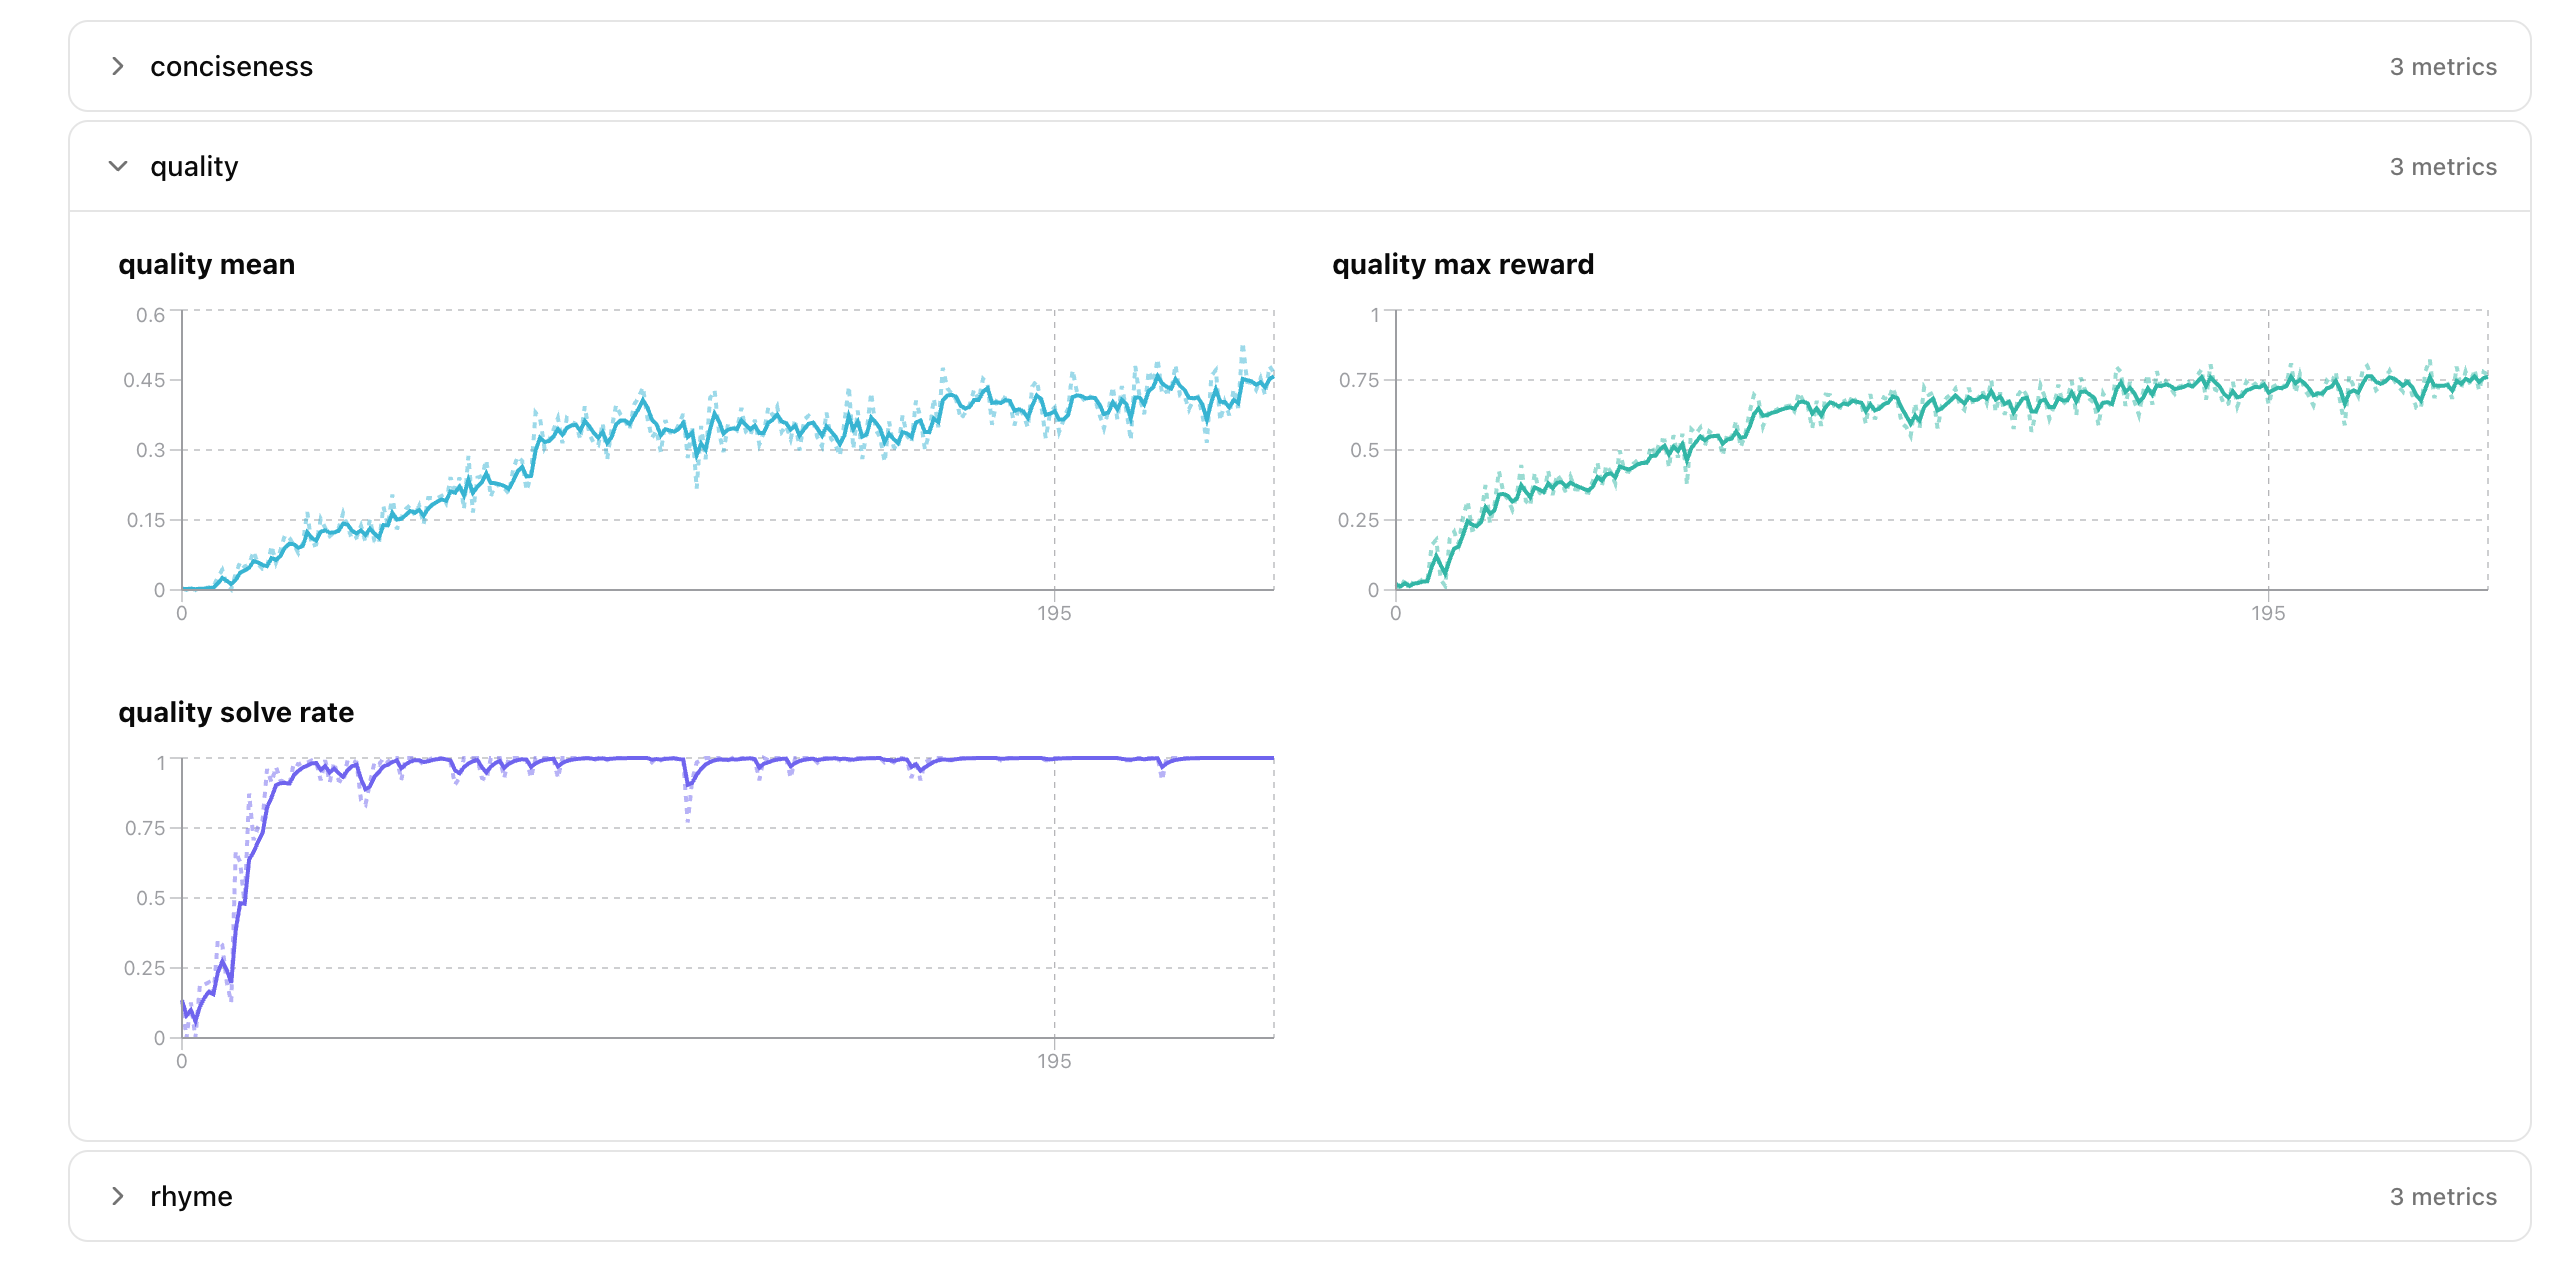
this lets you see which dimension is improving and which is lagging. for example, if quality is climbing but conciseness is flat, the model is getting better answers but not learning to be brief.
rollout deepdive
below the reward curves is the rollout deepdive. use this to inspect how your model performs for each prompt.
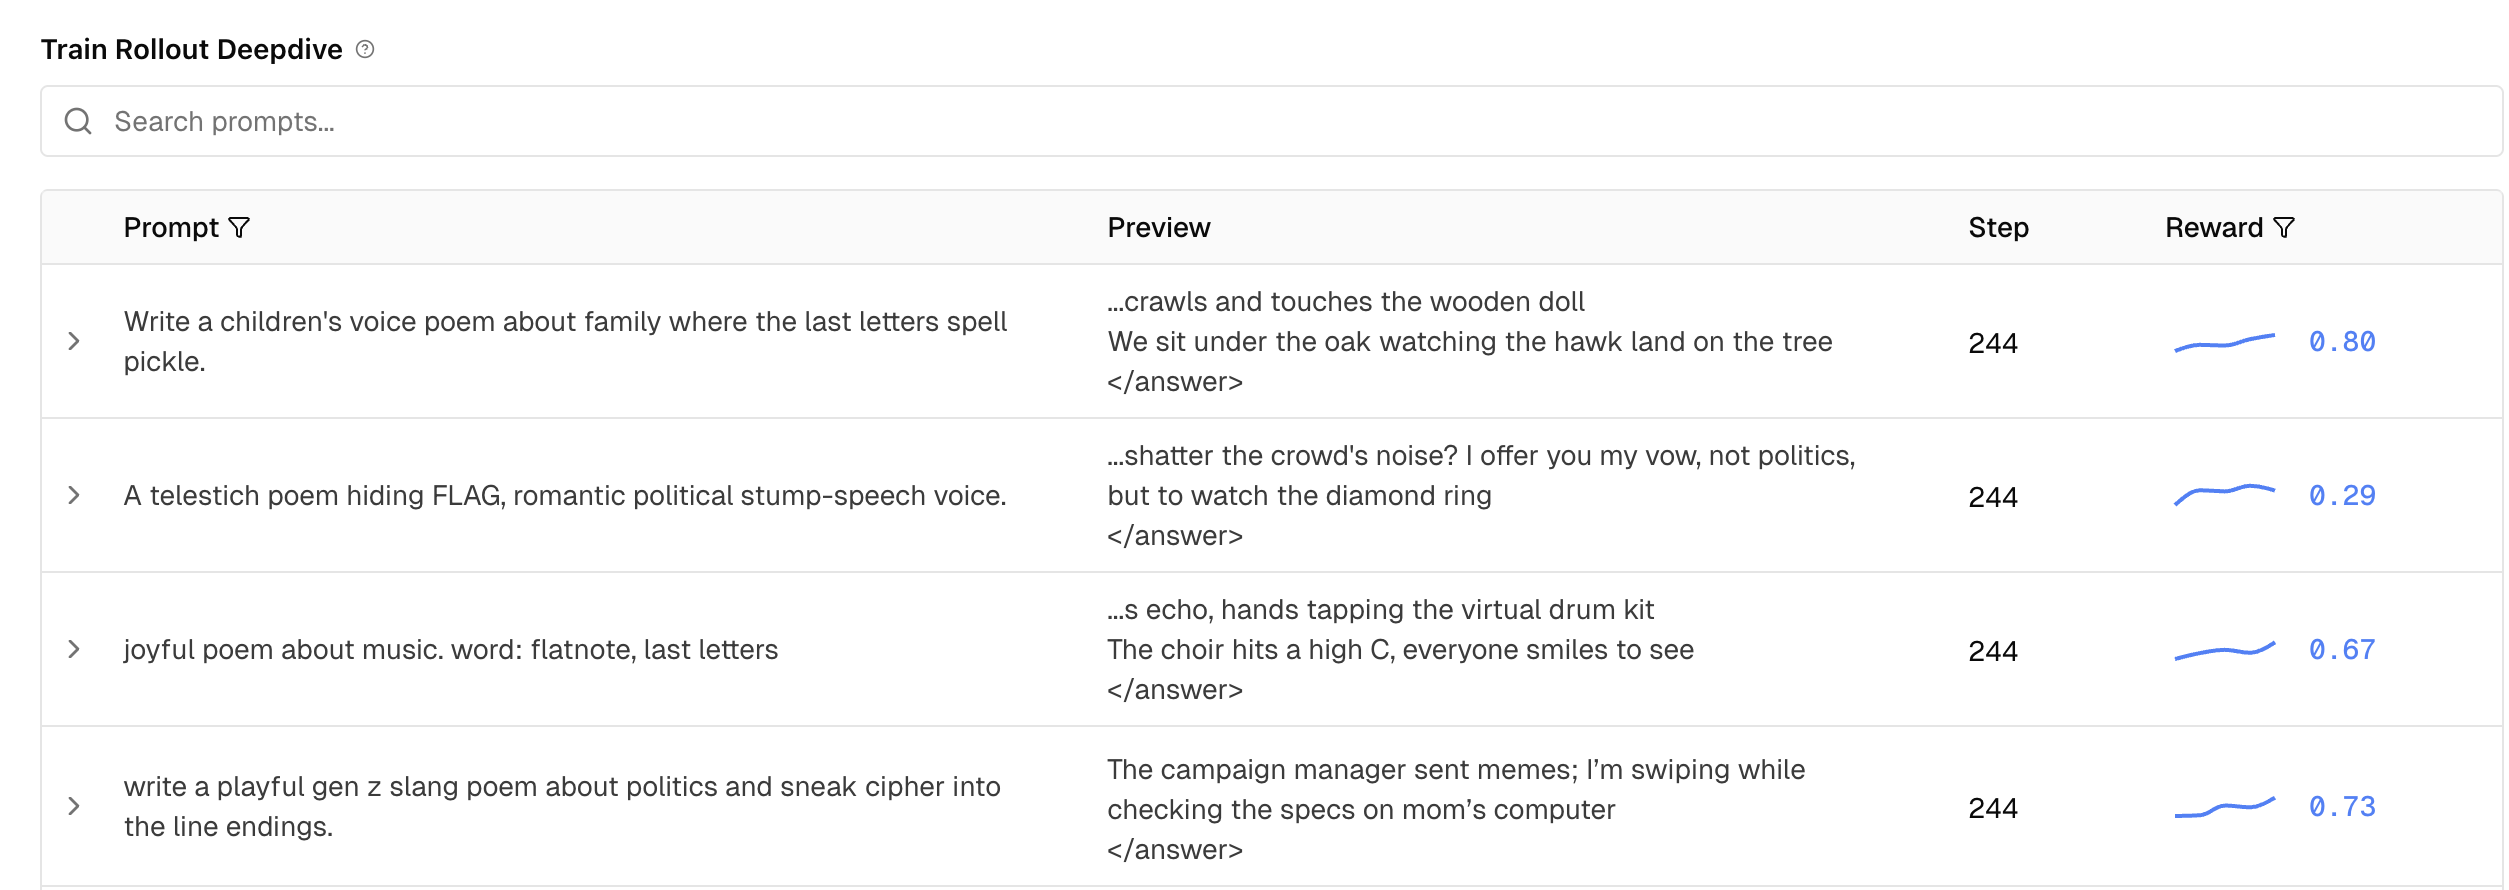
the table shows each prompt in your training set with a preview of the model’s latest completion, the current step, and the reward score. you can search prompts and filter by reward.
inspecting a prompt
click any prompt to expand it. at each training step, the model generates multiple rollouts (attempts) per prompt. the heatmap shows all rollouts across all steps.
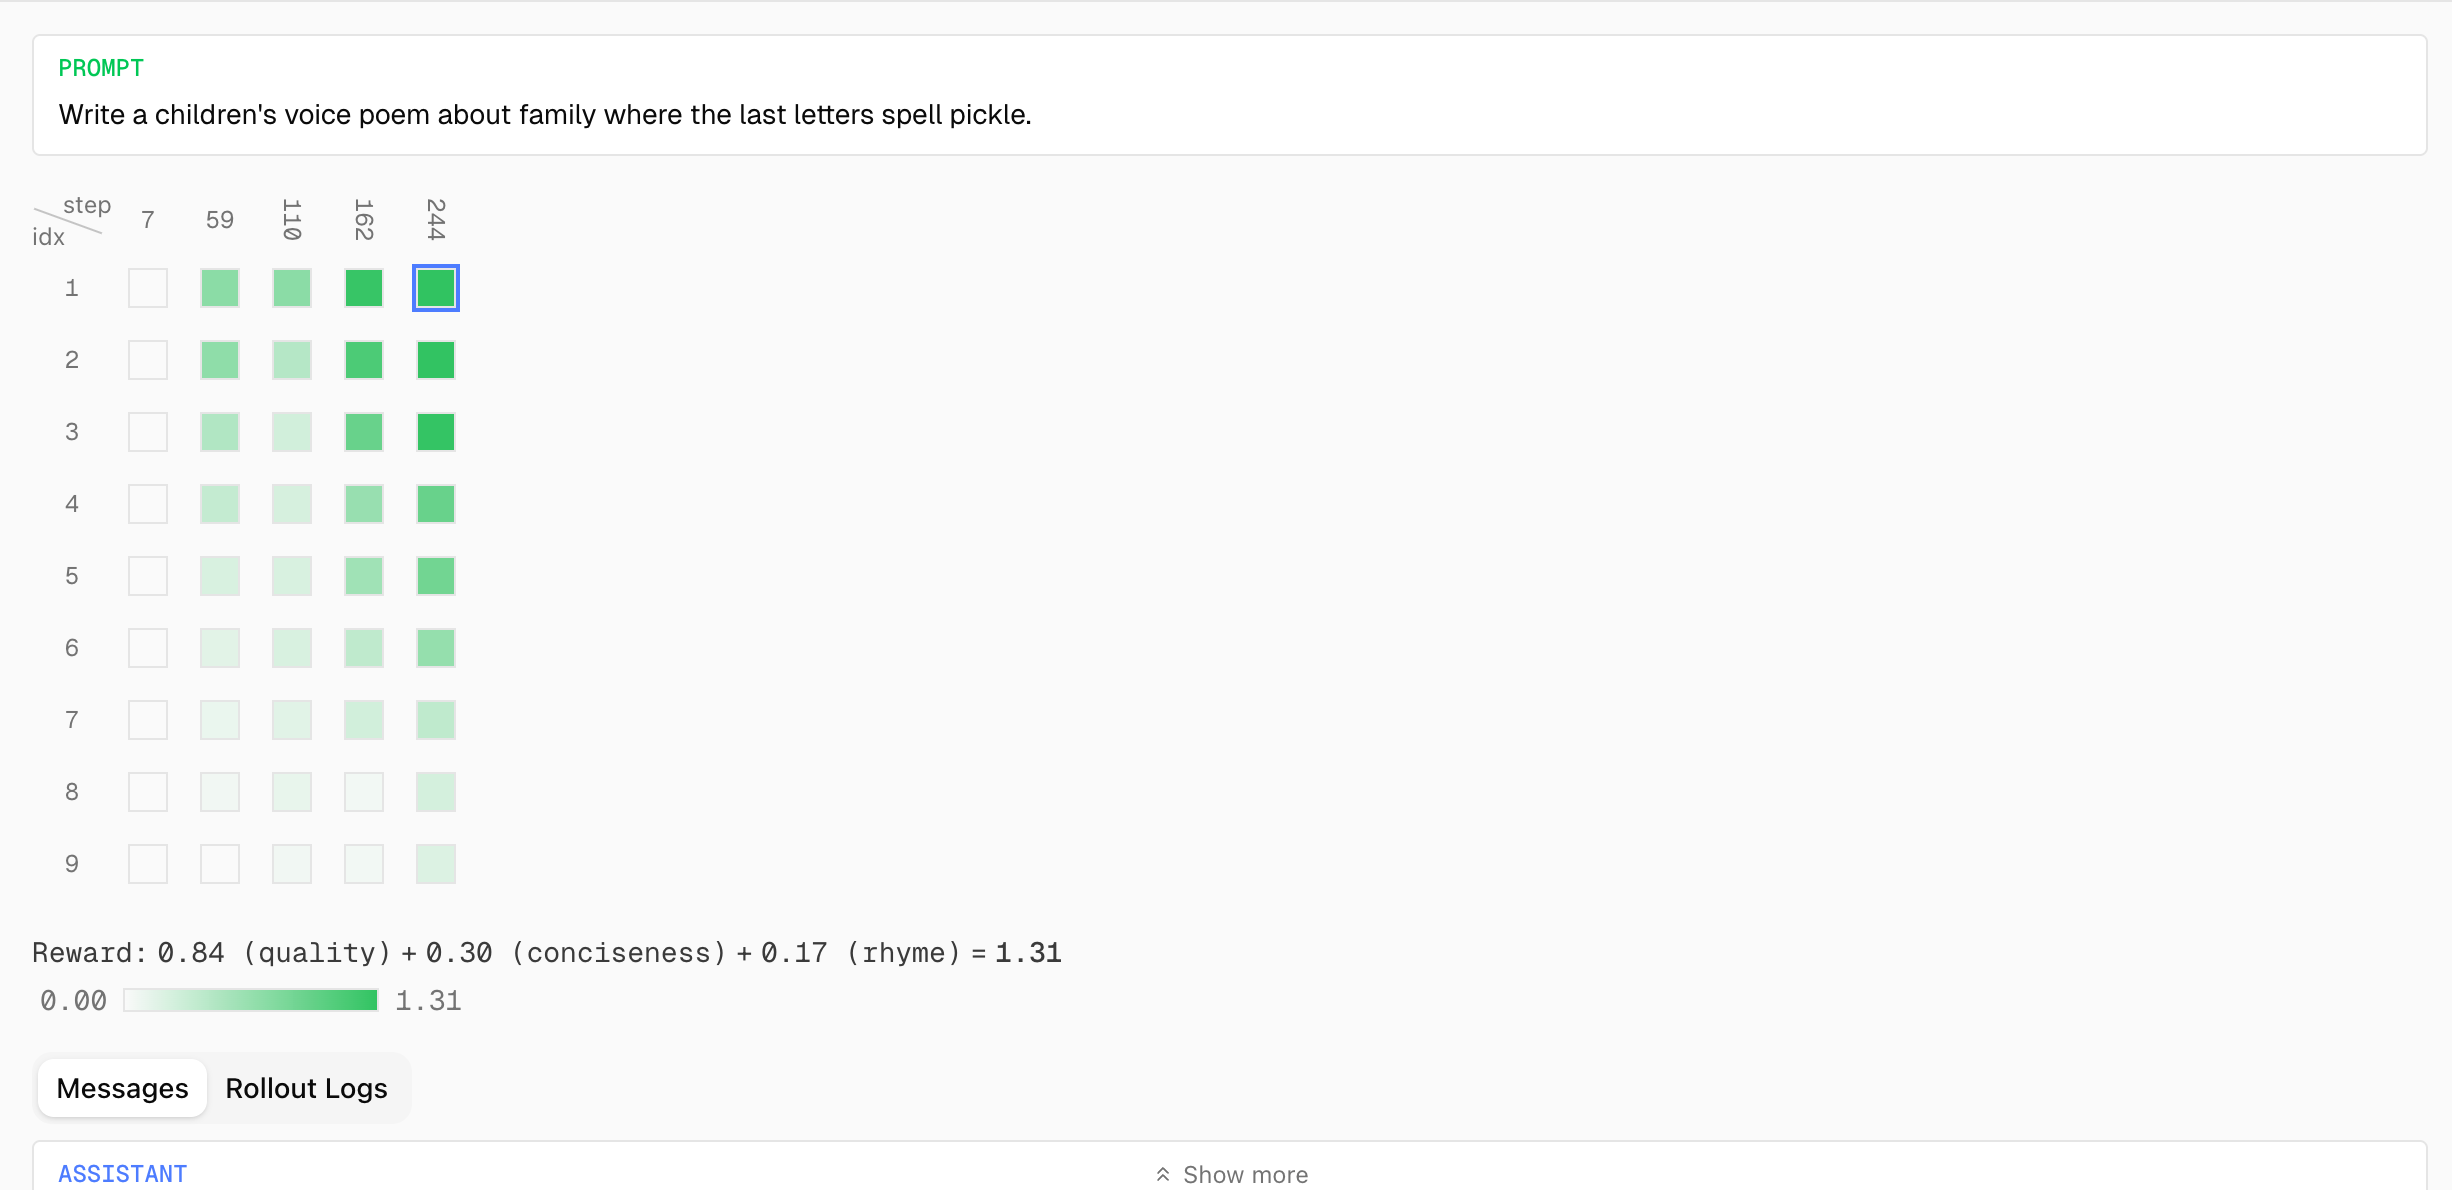
each column is a step, each row is one attempt. bolder green = higher reward. click any cell to inspect the full response.
the inspector shows:
- reward breakdown: the total reward as a sum of components (e.g.
0.84 (quality) + 0.30 (conciseness) + 0.17 (rhyme) = 1.31) - messages: the full conversation between the model and the environment, including tool calls and their results
- rollout logs: any messages logged via Python’s
loggingmodule during this rollout
what healthy training looks like
first ~50 steps: rewards fluctuate and metrics are noisy. this is normal. the model is exploring. don’t intervene.
steps 50-500: solve rate should be climbing. average reward may lag behind. this is healthy: the model is learning to solve more prompts.
plateau: both metrics level off. the model has saturated your training distribution. this is usually when to stop or adjust.
warning signs and what to do
| symptom | likely cause | action |
|---|---|---|
| solve rate flat, average reward rising | overfitting to easy prompts | add harder examples to training set, or increase diversity |
| both metrics flat from the start | reward signal too sparse or task too hard | check that your reward function gives partial credit where possible; try a simpler task first |
| eval reward declining while train reward rises | overfitting | stop training, use the checkpoint before divergence |
| reward jumps to 1.0 immediately | reward function is too easy or has a loophole | inspect high-reward completions for reward hacking |
| reward is always 0.0 | broken reward function | check that compute_reward handles the completion format correctly (it’s a message list, not a string) |
| response lengths rising continuously | model learning verbose answers | add a conciseness subreward, or gate existing rewards on brevity |
when to stop
there’s no universal stopping point. watch for:
- eval metrics plateauing: the model isn’t getting better on held-out data.
- eval diverging from train: the model is overfitting.
- completions look good: use the rollout deepdive to read 10-20 rollouts. if the answers are consistently good, you may be done.
when in doubt, keep a checkpoint from the current step and let training continue for another 100 steps. if eval metrics don’t improve, roll back to the checkpoint.
next steps
- evaluating your model: compare against baselines, run batch evals, test in the playground
- serving + sharing: deploy your model once training is complete